Card Sort Analysis:
AmeriCorps Navigation
The Study
I investigated AmeriCorps.gov while considering service opportunities and used its content for a UX foundations assignment in October 2024. The card sort explored how people grouped terms associated with the organization's programs, services, and participation.
The original Lyssna resultsrecord 10 self-recruited participants, all in the United States. Participants created their own categories for 30 cards. A follow-up question asked, "How would you help your community if you could?"
I used ChatGPT to generate the card terms after discussing the assignment and AmeriCorps search page. I then grouped the terms myself before reviewing participant results. The original report records uncertainty about card selection and my preference for fewer, broader categories.
My Initial Grouping
These four groups were my starting model. Their contents appear in the original report's diagram on page 3.
- What We Help: Environment, Disaster, Veterans, Social, National, Youth.
- What We Build: Development, Impact, Program, Skill, Initiative, Team.
- What We Need: Relief, Security, Community, Education, Support, Housing, Health, Training, Engagement, Inclusion, Employment, Connection.
- How We Work: Volunteer, Outreach, Mentor, Service, Full-time, Part-time.
Nine Categories from Participant Results
Participants produced 48 category labels. The report identifies "Work" as the only matching label across participants. I grouped related labels into nine categories, primarily using the participants' category names, then checked the cards within those groups:
- Community
- Demographics
- Education
- Employment
- Factors
- Military
- Needs
- Programs
- Volunteer
The agreement matrix on report page 5 shows how cards were distributed across those categories. Employment, for example, grouped Full-time, Part-time, and Employment strongly. Education gathered Skill, Education, and Training. Other cards spread across several categories, leaving more interpretation to the researcher.
Similarity Matrix Results
The similarity matrix measured how often participants placed two cards together, regardless of the category name. The original report records these pairings:
- 100 percent: Full-time, Part-time, and Employment were grouped together by every participant.
- 90 percent: Skill and Education.
- 80 percent: Engagement and Support; Health and Housing; Health and Disaster; Disaster and Environment.
I used ChatGPT in o1 Preview mode to help analyze the matrix. The report flags Impact, Initiative, and Team as inconsistent or ambiguous cards. It also records a longer AI-suggested list of possible outliers, without a formal statistical test. These observations supported revising vague card wording.
"Initiative," for example, could mean a campaign or a personal quality. "Team" could mean a group someone joins or something they build. The next study would need clearer terms before comparing alternative navigation structures.
Proposed Labels and Open Questions
After reviewing the results, I proposed renaming my four broad groups Focus, Foundations, Essentials, and Serve. I also considered using the nine consolidated categories or rebuilding the card set. The report ends with the choice between broad and granular groupings still open.
The study did not validate a final navigation design. Pairwise agreement and my thematic grouping suggested relationships to investigate; they did not establish that people would find programs more easily under the proposed labels. A follow-up navigation test would be needed to compare them.
Search Observations from 2024
While looking for service opportunities in 2024, I recorded problems beyond navigation labels: no keyword search, limited specific-location options, unclear program locations in results, repeated timeouts, and two separate search flows that were difficult to reconcile.
Those were observations from my own use of the site. The card sort did not test the search flows, and the study did not measure abandonment or completed applications. The report does not establish the current state of AmeriCorps.gov.
What I Learned
Comparing 48 labels was difficult in Lyssna. The original reflection describes trouble moving between grouped categories and individual responses, and uncertainty about whether my own preference for fewer groups was shaping the analysis. The nine-category synthesis used the same flexible reasoning that I had used for the initial four groups.
The study gave me specific card relationships, ambiguous terms to revise, and competing ways to organize the content. Search behavior remained a separate question requiring its own research.
Skills Demonstrated
My initial four-group model
The original diagram records my starting groups: What We Help, What We Need, What We Build, and How We Work. I later consolidated the participant labels into nine categories, shown on report page 5.
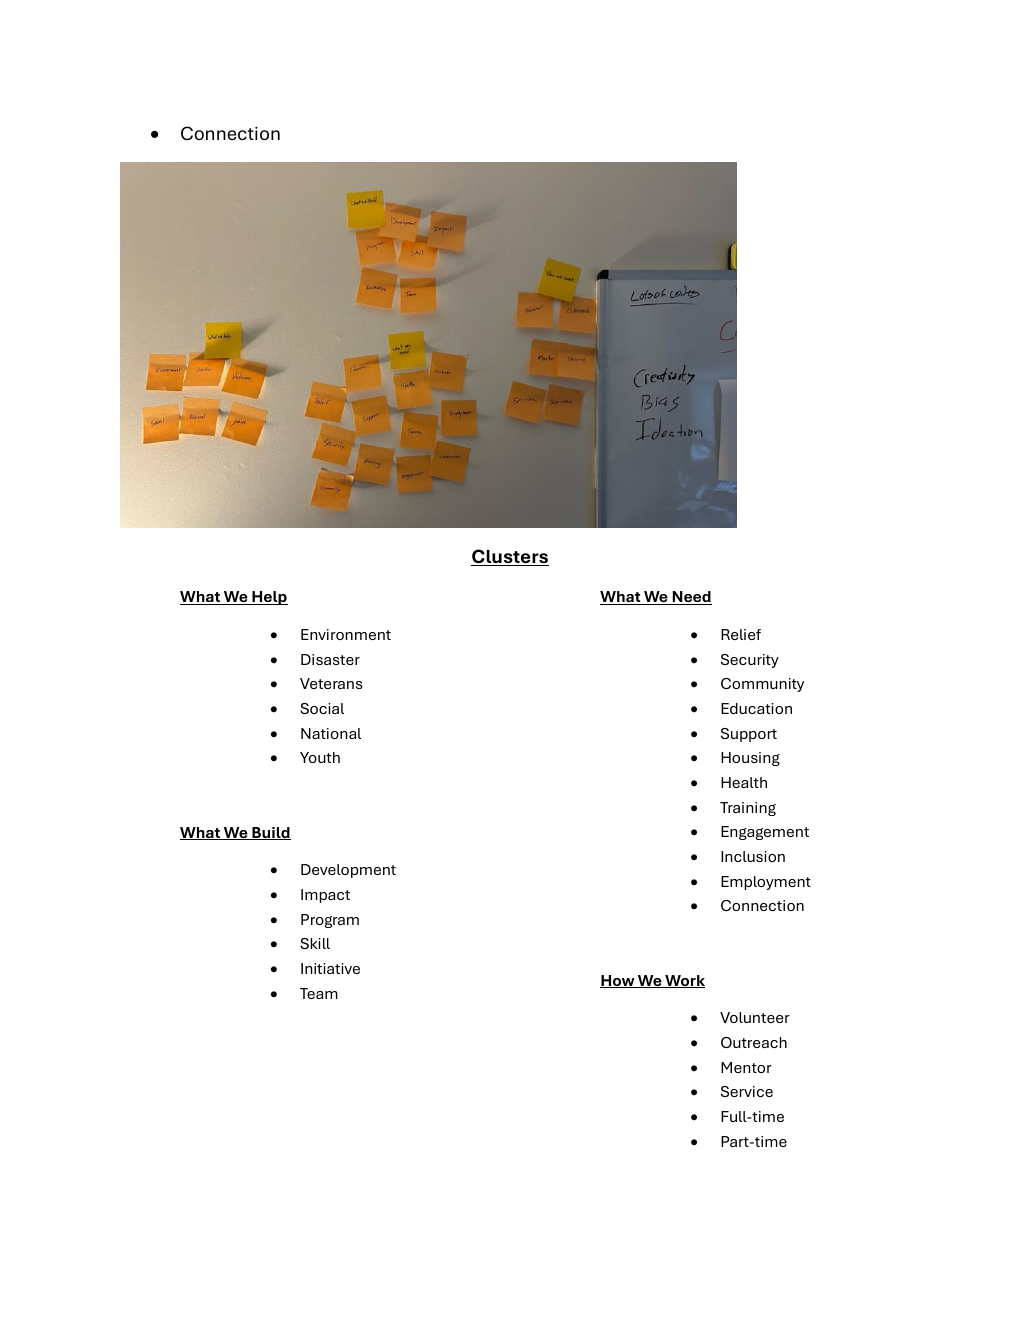
Evidence note James Dishman UX60501 Assignment 7 Card Sorting, original PDF page 3. Public excerpts preserve original page content; textual summaries identify the original locator and omit private material.
Original Submission
View original course artifact (PDF) →
This case-study summary was prepared with AI assistance and checked against the original October 2024 report and Lyssna results.